
Abstract From January to September 2014, the export volume and export volume of China's ceramic tiles continued to decline year-on-year. Compared with the first half of the year, the decline was narrowed. Exports rebounded markedly in the third quarter, and monthly exports resumed positive growth year-on-year. According to customs data, from January to September 2014, China has accumulated...
From January to September 2014, the export volume and export volume of China's ceramic tiles continued to decline year-on-year. Compared with the first half of the year, the decline was narrowed. Exports rebounded markedly in the third quarter, and monthly exports resumed positive growth year-on-year. According to customs data, from January to September 2014, China's cumulative export volume was 778 million square meters, down 1.50% year-on-year; the export value was 5.40 billion US dollars, down 2.68% year-on-year. I. Monthly export situation
In January 2014, China's ceramic tile exports reached 824 million US dollars, the highest value in the first three quarters, up 12.18% year-on-year; exports fell sharply in February, and the monthly export volume and export growth rate were the lowest in the first three quarters, respectively. The export volume decreased by 40% in March; the export volume increased slightly in the same period of last year; the export volume increased month by month in the second quarter, but continued to decline year by year, the decline was above 10%; in the third quarter, the monthly export volume increased significantly, and continued to rise year on year. In September, exports were 728 million US dollars, up 21.72% year-on-year, the highest growth rate in the first three quarters, as shown in Figure 1.
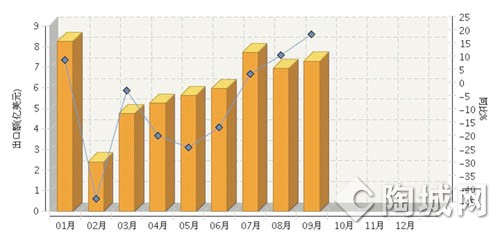
Figure 1 Monthly export volume of China's ceramic tiles from January to September 2014 and year-on-year
Second, the distribution of export areas
The export of ceramic tiles in Guangdong Province accounts for nearly 80% of the total export of ceramic tiles in China. According to customs data, from January to September 2014, the cumulative export of ceramic tiles in Guangdong was 4.142 billion US dollars, down 0.51% year-on-year, accounting for 76.56% of China's total ceramic tile exports. See Figure 2 for details.
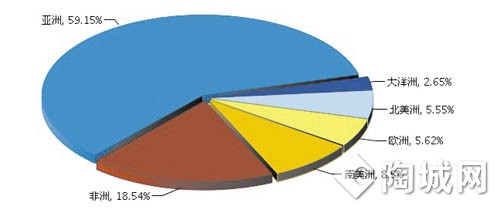
Figure 2 Regional share of China's ceramic tile exports from January to September 2014
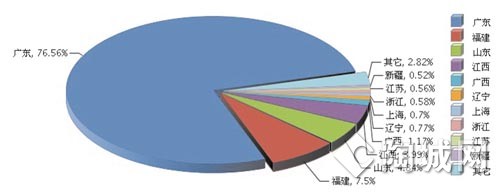
Figure 3 Year-on-year growth of China's ceramic bricks from January to September 2014
From the perspective of export growth rate, in the main export areas of China's ceramic tiles from January to September 2014, the export volume of Guangxi and Shandong increased significantly year-on-year, with the growth rate reaching 59.54% and 23.27%. The export volume of Jiangsu and Liaoning decreased sharply, with a decrease of 35.96% and 37.00% respectively. See Figure 3 for details.
Third, the distribution of exporting countries
According to customs data, from January to September 2014, China’s top five exporters of ceramic tiles were Malaysia, Indonesia, Saudi Arabia, Vietnam and the United States. Among them, exports to Malaysia were 356 million US dollars, down 7.43% year-on-year, accounting for 6.58% of China's total ceramic brick exports; exports to Indonesia were 273 million US dollars, up 38.05%, accounting for 5.05%; exports to Saudi Arabia were 259 million US dollars, down 29.01% year-on-year , accounting for 4.79%, as shown in Figure 4.
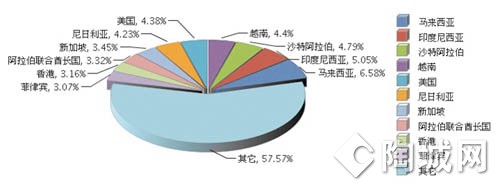
Figure 4 The proportion of the country's total exports of ceramic tiles from January to September 2014
In terms of export growth rate, exports to Vietnam, Nigeria and Indonesia increased significantly, with exports to Vietnam more than double the year-on-year, accounting for the fourth place from 10 in the previous year. Exports to Saudi Arabia, Singapore, and the United Arab Emirates fell by a year-on-year, down 29.01%, 16.60%, and 11.23%, respectively. See Figure 5.
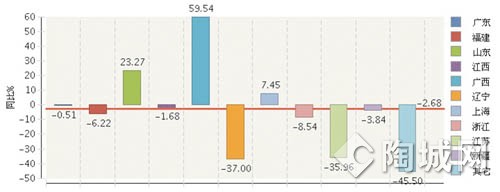
Figure 5 The cumulative growth of China's ceramic bricks from January to September 2014
Fourth, the distribution of exports to all continents
According to the export amount, nearly 60% of China's ceramic tiles are exported to Asia. According to customs data, from January to September 2014, China's ceramic tiles exported to Asia was 3.2 billion US dollars, accounting for 59.15% of China's ceramic brick exports, an increase of 2.26%, as shown in Figure 6.
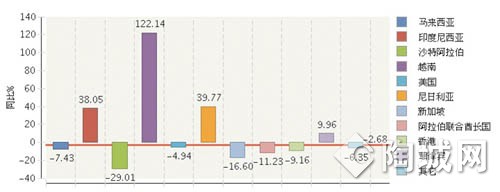
Figure 6 The cumulative export volume of ceramic tiles in China from January to September 2014
From the perspective of export growth rate, from January to September 2014, China's ceramic brick exports to Africa and Asia recovered positive growth from negative growth in the first half of the year, and exports to other continents continued to grow negatively. Among them, exports from Europe and South America fell sharply, down 30.81 year-on-year. %, 26.18%, as shown in Figure 7.
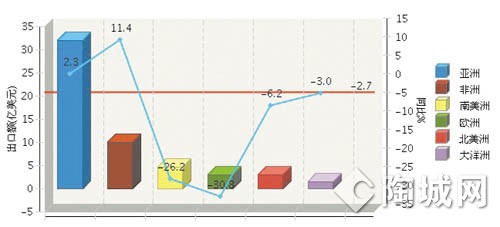
Figure 7 The cumulative export volume of ceramic tiles in China from January to September 2014
Led Rigid Strip Light,Rigid Led Strip Bar Light,Led Strip Rigid Bar Light,Milky Cover Led Rigid Bar Lights
Shenzhen You&My Electronic Technology Co., Ltd , https://www.ymledtrade.com